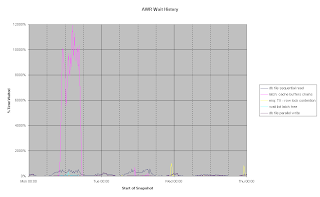
 One of my customers has an Oracle based system with a large number of concurrent users. For time to time, the users would report that the system would 'grind to a halt'. Examination of AWR data showed lots of time spent waiting on latch: cache buffers chains (I discussed how to graph AWR data in Excel in a previous blog entry, which is how I produced this graph of database wait events).
They system had been able to go for weeks without an incident. More recently, as more users have been migrated onto the system, we would a series of days with spikes on this wait event, though they were normally quite short-lived. The incident shown in this chart was unusual in that it lasted most of a day. The chart also shows that a reasonable amount of time was lost on db file sequential read, this is consistent with blocks being loaded into the buffer cache, requiring access to the cache buffer chains, and hence requiring access to the latch that protects these chain.
 Using a similar technique I was graph the number of database sessions over time, and I found a similar series of spikes.
By eye I could see that the spikes in the latch contention seemed to correspond to the spikes in the number of concurrent user sessions, and they had roughly the same shape.
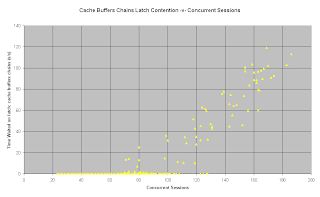
I then graphed time waited for this latch against the number of concurrent user sessions and I got a strong, and surprisingly linear, correlation.

It is very clear that whenever we had more than about 90 concurrent user sessions, the system also lost time waiting on the cache buffers chains latch. Basically, this application won't scale any further!
So, why was the latch being held for such a long time? The buffer cache is 1Gb (with a block size of 8Kb), so it is large, but not excessively so. At this point somebody (and I can't claim the credit for this) thought to check for migrated rows on the tables involved in the longest running SQL statements during the periods of high latch contention, and discovered that a number of the most heavily use tables had a significant quantity of migrated rows.
A row migrates when the data is updated and there is no free space left in the data block to store the new data values. Oracle puts the row into a new block, but it does not update the indexes to point to the new block. Instead, it puts a forwarding pointer into the original block. Therefore, to read the data from a migrated row requires visits to two blocks. When retrieving data into the buffer cache your process need to update two buffer blocks, and must acquire the buffer chains latch twice. Row migration causes poor performance because Oracle must do twice as much work.
There are two factors that come together to cause row migration:
- A process inserts a row, and then subsequently updates columns on that row, often from null to not null values, but sometimes with just more data. In my case, the application was storing XML structures in a clob (and most of the clobs were small enough to be stored in-line with the rest of the row).
- There is insufficient free space left in the data blocks to allow for the subsequent updates to be stored in the original data block.
 This chart shows the same data as the first one, except that I have changed the scale on the y-axis. The tables with the worst row migration were reorganised on the Tuesday night and the system ran on Wednesday under a normal load without any problem.
Contention on the buffer cache chains latch fell to trivial levels, just 408 seconds in 24 hours. Interestingly, the amount of db file sequential read also fell by 70%. This is due to better cache efficiency. Since eliminating much of the row migration, fewer blocks need to be loaded into cache, and so blocks stay in the buffer cache for longer.
This is a real-life example of:
- why it is important, sometimes critically so, to set physical attributes on tables properly;
- why it is necessary to understand how your application is updating the database;
- and what are the potential implications of not doing so!


