While that is an over-simplification, it is substantially true. The rest of this blog is about an exception to the general rule.
A War Story
I've been working with a system that makes extensive, and probably excessive, use of database links. There is a constellation of 3 Oracle databases and there are database links between them. There is also a soon-to-be legacy DB2 database, and one of the Oracle databases uses Oracle Transparent Gateway to create Heterogeneous Database Links over which the application running on Oracle references data in the DB2 database.During a load test, nearly all of the 64 application server processes are reported as busy handling requests, yet ASH reports than usually less than 2 database sessions are concurrently busy. You would expect to see 60 application server processes consuming CPU, but CPU does not appear to be as highly utilised as we should expect.
An application SQL trace reports that while the majority of the time is indeed spent on client CPU, about 20% is spent on a few SQL statements that reference synonyms that refer to tables or views in a DB2 database. Why didn't these show up in ASH?
A Simple Test Script
I wrote a simple test script that just executes the SQL statements that refer to the DB2 objects, but it collects AWR snapshots at the beginning and end of the script, and it also enables Oracle session trace.set verify on head on timi on feedback on lines 200 trimspool on
spool otg_db2
variable b1 VARCHAR2(10)
variable b2 VARCHAR2(10)
BEGIN
:b1 := '123456789';
:b2 := '42';
END;
ALTER SESSION SET tracefile_identifier='OTG_DB2';
ALTER SESSION SET current_schema=APPSCHEMA;
EXEC dbms_workload_repository.create_snapshot;
EXEC dbms_application_info.set_action('OTG_DB2');
EXEC dbms_monitor.session_trace_enable;
SELECT …
FROM db2_object1 a
WHERE a.field1 = :b1 AND a.field2 = :b2
/
SELECT …
FROM db2_object2 a
WHERE a.field1 = :b1 AND a.field2 = :b2
/
…
exec dbms_application_info.set_action('NONE');
exec dbms_monitor.session_Trace_disable;
exec dbms_workload_repository.create_snapshot;
select sample_id, sample_time, sql_id, sql_plan_hash_value, sql_plan_line_id, sql_exec_id, event
from v$active_session_history
where action = 'OTG_DB2';
spool off
So, now let's look at the trace file. This is the output for the longest SQL statement having profiled it in TKPROF. We can see that nearly all the time is spent on an event called HS message to agent.
SELECT …
FROM db2_object1 a
WHERE a.field1 = :b1 AND a.field2 = :b2

call     count       cpu    elapsed       disk      query    current        rows
------- ------  -------- ---------- ---------- ---------- ----------  ----------
Parse        1      0.00       0.00          0          0          0           0
Execute      1      0.00       0.04          0          0          1           0
Fetch        1      0.00       2.73          0          0          0           0
------- ------  -------- ---------- ---------- ---------- ----------  ----------
total        3      0.00       2.77          0          0          1           0

Misses in library cache during parse: 1
Misses in library cache during execute: 1
Optimizer mode: ALL_ROWS
Parsing user id: 35

Elapsed times include waiting on following events:
  Event waited on                             Times   Max. Wait  Total Waited
  ----------------------------------------   Waited  ----------  ------------
  Disk file operations I/O                        1        0.00          0.00
  DFS lock handle                                 1        0.00          0.00
  rdbms ipc reply                                 2        0.00          0.00
  HS message to agent                             5        2.73          2.77
  SQL*Net message to client                       1        0.00          0.00
  SQL*Net message from client                     1        0.00          0.00
PARSING IN CURSOR #4579254328 len=171 dep=0 uid=35 oct=3 lid=0 tim=14984112395546 hv=1291470523 ad='700010b2204a518' sqlid='xxxxxxxxxxxxx'
SELECT …
FROM db2_object1 a
WHERE a.field1 = :b1 AND a.field2 = :b2
END OF STMT
PARSE #4579254328:c=106,e=172,p=0,cr=0,cu=0,mis=1,r=0,dep=0,og=1,plh=0,tim=14984112395545
WAIT #4579254328: nam='Disk file operations I/O' ela= 23 FileOperation=8 fileno=0 filetype=8 obj#=-1 tim=14984112395633
WAIT #4579254328: nam='DFS lock handle' ela= 5205 type|mode=1146617861 id1=3569868743 id2=0 obj#=-1 tim=14984112401137
WAIT #4579254328: nam='rdbms ipc reply' ela= 75 from_process=46 timeout=900 p3=0 obj#=-1 tim=14984112401291
WAIT #4579254328: nam='rdbms ipc reply' ela= 710 from_process=46 timeout=900 p3=0 obj#=-1 tim=14984112402047
WAIT #4579254328: nam='HS message to agent' ela= 3464 p1=0 p2=0 p3=0 obj#=-1 tim=14984112405590
WAIT #4579254328: nam='HS message to agent' ela= 38459 p1=0 p2=0 p3=0 obj#=-1 tim=14984112444724
WAIT #4579254328: nam='HS message to agent' ela= 17 p1=0 p2=0 p3=0 obj#=-1 tim=14984112444791
EXEC #4579254328:c=932,e=49215,p=0,cr=0,cu=1,mis=1,r=0,dep=0,og=1,plh=0,tim=14984112444865
WAIT #4579254328: nam='SQL*Net message to client' ela= 2 driver id=1650815232 #bytes=1 p3=0 obj#=-1 tim=14984112444958
WAIT #4579254328: nam='HS message to agent' ela= 2730045 p1=0 p2=0 p3=0 obj#=-1 tim=14984115175093
WAIT #4579254328: nam='HS message to agent' ela= 8 p1=0 p2=0 p3=0 obj#=-1 tim=14984115175165
FETCH #4579254328:c=206,e=2730295,p=0,cr=0,cu=0,mis=0,r=0,dep=0,og=1,plh=0,tim=14984115175285
WAIT #4579254328: nam='SQL*Net message from client' ela= 895 driver id=1650815232 #bytes=1 p3=0 obj#=-1 tim=14984115176264
CLOSE #4579254328:c=10,e=16,dep=0,type=0,tim=14984115176343
OVERALL TOTALS FOR ALL NON-RECURSIVE STATEMENTS

call     count       cpu    elapsed       disk      query    current        rows
------- ------  -------- ---------- ---------- ---------- ----------  ----------
Parse        9      0.00       0.00          0          0          0           0
Execute     10      0.00       0.21          0          0          1           3
Fetch        7      0.00       5.10          0          0          0           0
------- ------  -------- ---------- ---------- ---------- ----------  ----------
total       26      0.01       5.32          0          0          1           3

Misses in library cache during parse: 3
Misses in library cache during execute: 4

Elapsed times include waiting on following events:
  Event waited on                             Times   Max. Wait  Total Waited
  ----------------------------------------   Waited  ----------  ------------
  SQL*Net message to client                       9        0.00          0.00
  SQL*Net message from client                     9        0.00          0.00
  Disk file operations I/O                        9        0.00          0.00
  DFS lock handle                                 1        0.00          0.00
  rdbms ipc reply                                 2        0.00          0.00
  HS message to agent                            29        2.73          5.30
  library cache pin                               2        0.00          0.00
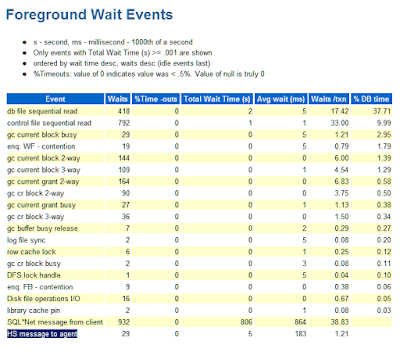
We (should) know that 'SQL*Net message from client' is an idle event. So we can understand that there are 806 seconds reported on this event in this AWR report because there were 151 sessions connect to the database, most of which were mostly idle for the 6 seconds between the AWR snapshots. That is perfectly normal.
However, HS message to agent is classed as an idle wait, although the user was not idle. During this event the application is not busy, it is waiting for the Oracle database to respond, which is, in turn, waiting for the remote non-Oracle database to respond.
This is in contrast to Oracle-to-Oracle (homogeneous) database links which report time to 'SQL*Net message from dblink' which is not an idle wait, but part of the 'Network' wait class. I think the difference is an anomaly.
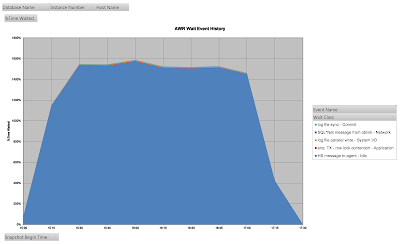
The next question is how much time my application spent on this event. For that I must look at the AWR data, either by generating an AWR report that corresponds to the load test, or directly in dba_hist_system_event.
Conclusion
- I am not the first person to call this out, just the latest person to get caught by it. It may be an idle wait, but the user is waiting for the database to respond.
Database Link Wait Event Wait Class Heterogeneous HS message to agent Idle Homogeneous SQL*Net message from dblink Network - I got as far as starting to write an e-mail to a colleague asking for help, but before sending it I realised that I could do more to find out what was happening. Perhaps just the act of trying to explain the problem helped me to think more clearly about it.


